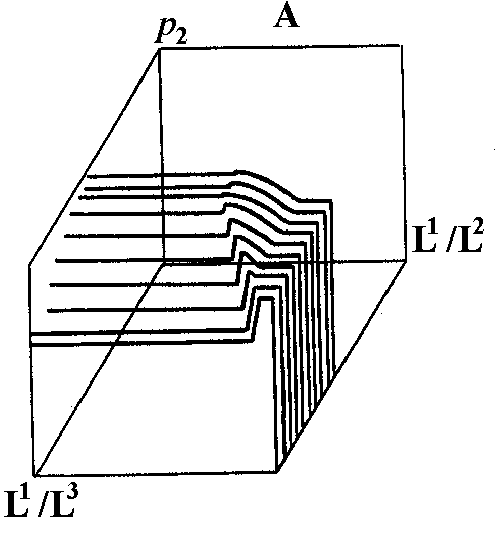
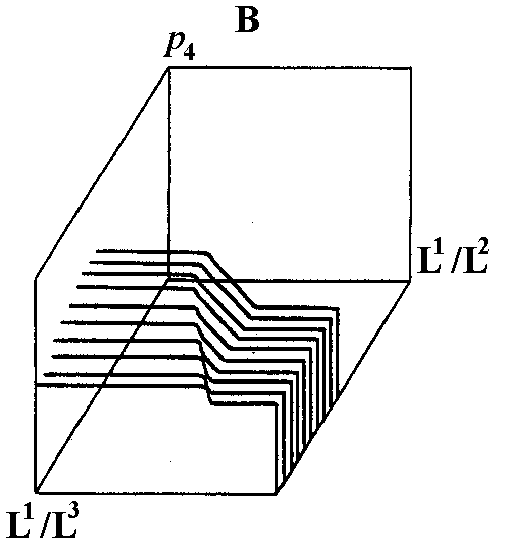
Fig. 7. The relative abundances pi = xi/n (i = 2 for A and i = 4 for B) as functions of L1/L2 and L1/L3 in a three-factor model (L1/L2 ranges from 0 to 4.955 in A and from 0 to 6.494 in B, L1/L3 — from 0 to 0.952, p2 — from 0 to 0.3153,
р4 — from 0 to 0.8752).